


WorldDAB’s latest report shows that by the end of Q2 2020, cumulative DAB/DAB+ receiver sales in Europe and Asia Pacific reached 93 million. That number stood at 82 million just a year earlier.
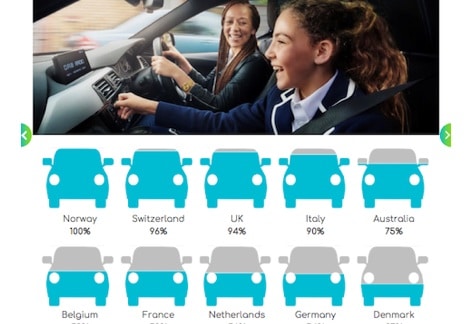
The new WorldDAB data, available to download as an infographic, provides an overview of DAB receiver (consumer and automotive) sales, road and population coverage. It also provides details on household penetration and the number of national stations on DAB/DAB+ compared to FM. The report covers Australia, Belgium, Denmark, France, Germany, Italy, the Netherlands, Norway, Switzerland and the United Kingdom.
On a pan-European level, the European Electronic Communications Code (EECC), adopted in December 2018, requires all new car radios in the EU to be capable of receiving digital terrestrial radio from Dec. 21.
Key Findings
The report shows that in Switzerland 71% of radio listening is on digital platforms (39% on DAB+). The country is planning for a digital switchover between 2022 and 2023. It also unveils that in Germany 25% of households own at least one DAB receiver. The nation welcomed a second national multiplex in October.
The study’s other key findings indicate sales of consumer DAB+ radios in Italy almost tripling in the first half of the year, and that 65% of households in the U.K. have at least one DAB receiver. In addition, it shows 75% of new cars in Australia are now sold with DAB+, up from 60% in 2018
WorldDAB adds that DAB is also seeing “significant activity across Africa, Asia and the Middle East.” The infographic details the rollout status in 24 emerging markets including information on trials and population coverage.
“In spite of the pandemic, 2020 has been a strong year for DAB+ radio. The EECC takes effect from the end of this year. And interest in DAB+ is growing Europe, including parts of Africa and the Middle East,” said WorldDAB President, Patrick Hannon.
Download the infographic here.